
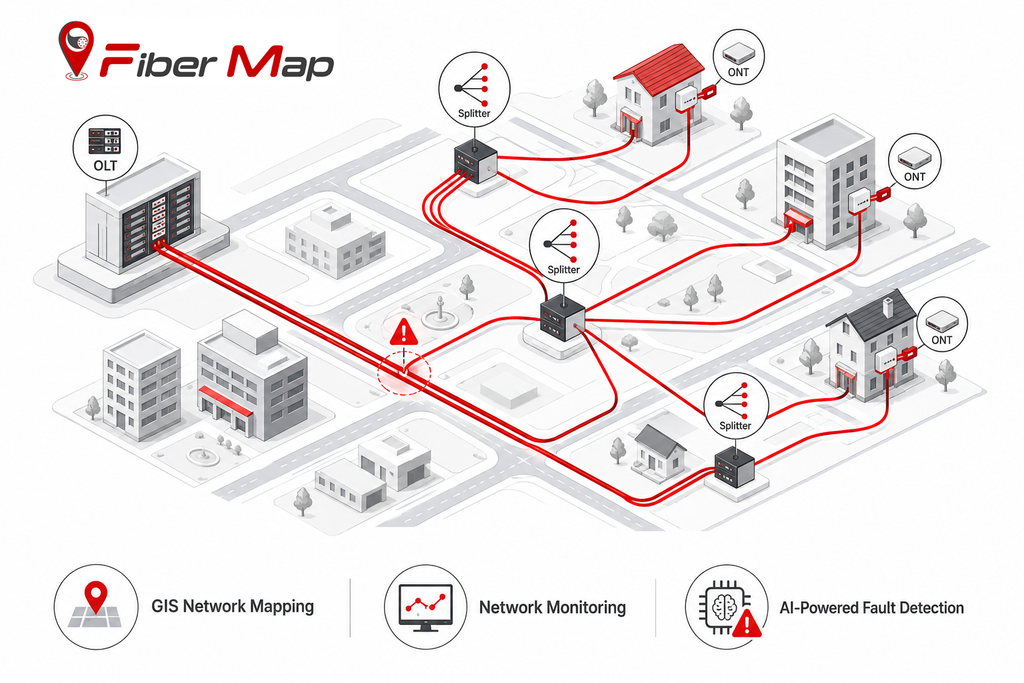
Managing a growing FTTH network becomes increasingly difficult when fiber routes, OLTs, splitters, ONTs, subscribers, and faults are spread across disconnected systems. FiberMap brings these network elements together on a GIS-based platform, helping ISPs visualize their infrastructure, monitor connectivity, and identify potential faults more efficiently.
From GIS fiber network mapping to AI-powered fault detection, FiberMap provides a clearer operational view of the physical and logical network.
Table of Contents
- Why Fiber Network Visibility Matters
- What Is GIS-Based Fiber Network Mapping?
- Mapping the Complete FTTH Infrastructure
- Network Monitoring Beyond the Map
- AI-Powered Fault Detection
- How FiberMap Addresses Key ISP Network Challenges
Why Fiber Network Visibility Matters
For an ISP, knowing where network equipment is located is only part of the challenge. Operations teams also need to understand how each component is connected and how a fault in one section can affect downstream subscribers.
A typical FTTH network may include OLTs, fiber cables, splitters, joints, ONTs, poles, buildings, and subscriber connections. When this information is maintained across spreadsheets, static drawings, or separate applications, troubleshooting and network planning can become time-consuming.
A centralized fiber network management platform provides a visual reference for understanding the network and making operational decisions faster.
What Is GIS-Based Fiber Network Mapping?
GIS-based fiber network mapping combines geographic information with network infrastructure data. Instead of viewing fiber assets as isolated records, an ISP can see them in relation to roads, buildings, service areas, and connected network equipment.
A digital fiber map can show the path from an OLT through distribution infrastructure and splitters to customer premises. This makes it easier for network teams to understand physical connectivity and locate infrastructure in the field.
FiberMap uses this approach to create a visual representation of FTTH infrastructure, helping teams move from disconnected asset information to a more comprehensive network view.
Mapping the Complete FTTH Infrastructure
An effective fiber mapping solution should represent more than cable routes.
FiberMap’s network visualization can represent key infrastructure such as:
- OLT locations and connectivity
- Fiber routes across service areas
- Optical splitters and distribution points
- ONTs at customer premises
- Subscriber locations
- Joints and other network assets
- Poles and physical infrastructure
The visual representation makes the relationship between network components easier to understand. For example, when a downstream connection is affected, technicians can identify the relevant route and network components instead of searching through disconnected records.
This is particularly useful for expanding FTTH networks, maintaining existing infrastructure, and planning future deployments.
Network Monitoring Beyond the Map
A network map becomes significantly more useful when it is connected to operational information.
Fiber network monitoring allows ISPs to move beyond simply knowing where equipment is located and gain better visibility into network conditions. Monitoring can help operations teams identify abnormal conditions, investigate service issues, and understand affected network segments.
By combining network infrastructure information with monitoring data, teams can establish a stronger connection between physical infrastructure and network operations.
This can reduce the gap between the NOC, field technicians, and network planning teams.
AI-Powered Fault Detection
Traditional troubleshooting often begins after a subscriber reports a problem. By that point, technicians may need to investigate multiple network components before identifying the underlying issue.
AI can change this approach by helping identify patterns and potential abnormalities earlier.
AI-powered fault detection can assist network teams in identifying areas that require attention and prioritizing troubleshooting. When AI capabilities are combined with a geographic view of the infrastructure, teams can better understand where a potential issue is occurring and which network elements may be involved.
For FTTH operators managing large and distributed networks, this combination of GIS visualization, monitoring, and AI can support faster and more informed troubleshooting.
How FiberMap Addresses Key ISP Network Challenges
As FTTH networks expand, ISPs face increasing pressure to maintain accurate infrastructure records, resolve faults quickly, and coordinate field operations efficiently. FiberMap addresses these challenges by bringing network mapping, monitoring, and AI-powered insights into a unified platform.
1. Scattered Network Information → One Visual Network View
Network information is often distributed across spreadsheets, drawings, asset records, and different operational systems, making it difficult to understand the complete network.
A GIS-based fiber network map brings OLTs, splitters, fiber routes, ONTs, joints, poles, buildings, and subscribers into a connected geographic view.
Teams can understand network topology and physical infrastructure without switching between multiple sources.
2. Time-Consuming Fault Investigation → Faster Network Tracing
When a subscriber experiences an outage, technicians may need to manually determine the affected route and identify the equipment serving that location.
Visual route tracing helps teams follow the connection from the network source through intermediate infrastructure to the subscriber.
Technicians can narrow down affected network segments faster and reduce unnecessary field investigation.
3. Reactive Troubleshooting → AI-Assisted Fault Detection
Conventional troubleshooting often starts only after a customer reports a service problem.
AI-powered fault detection can help identify abnormal network conditions and highlight areas requiring attention.
Operations teams can move toward more proactive network monitoring and potentially address issues before they affect a larger subscriber base.
4. Difficult Field Operations → Better Infrastructure Visibility
Field technicians need accurate information about equipment locations, routes, and connections while working on-site.
Geographic visualization provides a clearer representation of physical network infrastructure and connected assets.
Technicians can spend less time searching for infrastructure and more time performing maintenance or resolving service issues.
5. Complex Network Expansion → Better Planning
Expanding an FTTH network requires understanding existing routes, equipment capacity, service coverage, and nearby infrastructure.
A centralized network map provides a visual foundation for evaluating existing infrastructure and planning new deployments.
ISPs can make network expansion and feasibility decisions with better visibility into their existing fiber infrastructure.
6. Growing Network Complexity → Centralized Network Management
As subscriber numbers and fiber infrastructure grow, maintaining visibility becomes increasingly important. FiberMap connects network mapping, monitoring, asset visibility, and AI-driven fault detection to help ISPs manage their infrastructure from a unified environment.
The result is a more organized approach to FTTH network operations, from everyday troubleshooting to long-term network planning.
Make Your Fiber Network Easier to See and Manage
A growing fiber network shouldn’t mean growing complexity. With FiberMap, ISPs can visualize their infrastructure, trace connections, monitor network conditions, and use AI-powered insights to support faster and smarter network operations.
Explore FiberMap and discover a smarter way to manage your FTTH network.